An interesting question popped up in the discussions around my World Cup simulations and more specific the somewhat lower than expected predicted performance of Senegal compared to home nation Qatar in group A.
Amir commented:
"Elo indeed has a regional problem - since there are not many matches between teams from different confederations, it takes a long time for ELO to adjust to the actual average per confederation.
If the difference are getting smaller (which is something worth testing), it means that Elo will indeed under-estimate CAF."
Apart from the difficulty to determine the "actual average per confederation", I personally have the impression that elo ratings are not regionally biased, because there isn't anything in the elo calculation that's influenced by the team's confederation. But maybe, indeed the number of intraconfederational versus interconfederational matches a team playes could be the exogenous factor. I decided to give it a go and research this.
First I will describe the features of the elo rating calculation:
- elo-ratings of both teams in a match are adjusted according to the difference in elo-ratings between both teams before the match with the home team, having home field advantage, receiving an extra 100 rating points. The rating points one team wins are lost by the other in all circumstances: it is a zero-sum system with a constant number of points in the system, unless a completely new team is introduced to the ranking;
- in case a new team is introduced in the system a starting points number is estimated for the team. Within some 30 matches the points total for the new team is finetuned against the points of their opponents in those matches and their points total will, from that point on, reflect their 'true' strength;
- every match of the National Team of each country counts, at least: to the discretion of the maintainer of the elo-system. For instance the matches in the African Nations Championships where countries are only allowed to select players from their own domestic league, are excluded. On the other hand, matches of Senegal in the last COSAFA Cup, where they played as a guest without their European-based stars, were included;
- 5 different types of matches with corresponding weights are applied:
- 60 - World Cup finals (WC);
- 50 - continental championship finals (EURO, Copa America, Gold Cup and the Nations Cups of AFC. CAF and OFC) and major intercontinental tournaments (the former Confederations Cup);
- 40 - WC and continental qualifiers and major tournaments like f.i. the Arab Cup, COSAFA Cup, the regional championships in Asia (East, South-East, South, West), Gulf Cup etc.;
- 30 - all other tournaments;
- 20 - friendly matches;
- also the goal difference in a match has an effect on the exchanged rating points;
- see http://www.eloratings.net/about for all the details.
I selected from my match database all matches played since January 1st 1980 which are included in the elo rating calculation and determined the match type and confederation of each participating team. There were in that time frame three confederation changes:
- Israel switched per 1/1/1994 from AFC to UEFA;
- Kazakhstan switched per 1/1/2002 from AFC to UEFA;
- Australia switched per 1/1/2006 from OFC to AFC.
The distribution over the match types in this sample:
|
type |
N |
perc |
|
60 |
592 |
2% |
|
50 |
2.242 |
7% |
|
40 |
16.697 |
50% |
|
30 |
3.005 |
9% |
|
20 |
10.952 |
33% |
|
total |
33.488 |
Here are tables with the intraconfederational (own confed) versus interconfederational (other confed) matches per confederation and match type. Note that per confederation the matches are counted with at least one team from that confederation involved. This means that the line with the totals shows not the summed number of matches per confederation against other confederations but only half of it:
|
All matches |
|||||
|
against |
|||||
|
confed |
own confed |
other confed |
own confed |
other confed |
current number of member NT's |
|
AFC |
6.177 |
2.197 |
74% |
26% |
46 |
|
CAF |
7.731 |
1.430 |
84% |
16% |
54 |
|
CONCACAF |
3.863 |
1.667 |
70% |
30% |
35 |
|
CONMEBOL |
1.426 |
1.844 |
44% |
56% |
10 |
|
OFC |
714 |
401 |
64% |
36% |
11 |
|
UEFA |
8.483 |
2.649 |
76% |
24% |
55 |
|
total matches |
28.394 |
5.094 |
85% |
15% |
|
|
K=60: WC finals |
|||||
|
against |
|||||
|
confed |
own confed |
other confed |
own confed |
other confed |
|
|
AFC |
1 |
107 |
1% |
99% |
|
|
CAF |
0 |
132 |
0% |
100% |
|
|
CONCACAF |
1 |
99 |
1% |
99% |
|
|
CONMEBOL |
8 |
193 |
4% |
96% |
|
|
OFC |
0 |
6 |
0% |
100% |
|
|
UEFA |
144 |
339 |
30% |
70% |
|
|
total matches |
154 |
438 |
26% |
74% |
|
|
K=50: continental
championship finals and major intercontinental tournaments |
|||||
|
against |
|||||
|
confed |
own confed |
other confed |
own confed |
other confed |
|
|
AFC |
319 |
61 |
84% |
16% |
|
|
CAF |
618 |
40 |
94% |
6% |
|
|
CONCACAF |
325 |
179 |
64% |
36% |
|
|
CONMEBOL |
308 |
192 |
62% |
38% |
|
|
OFC |
65 |
28 |
70% |
30% |
|
|
UEFA |
327 |
60 |
84% |
16% |
|
|
total matches |
1.962 |
280 |
88% |
12% |
|
|
K=40: WC and continental
qualifiers and major tournaments |
|||||
|
against |
|||||
|
confed |
own confed |
other confed |
own confed |
other confed |
|
|
AFC |
3.683 |
147 |
96% |
4% |
|
|
CAF |
4.465 |
70 |
98% |
2% |
|
|
CONCACAF |
2.327 |
11 |
100% |
0% |
|
|
CONMEBOL |
691 |
15 |
98% |
2% |
|
|
OFC |
454 |
63 |
88% |
12% |
|
|
UEFA |
4.913 |
22 |
100% |
0% |
|
|
total matches |
16.533 |
164 |
99% |
1% |
|
|
K=30: all other tournaments |
|||||
|
against |
|||||
|
confed |
own confed |
other confed |
own confed |
other confed |
|
|
AFC |
851 |
483 |
64% |
36% |
|
|
CAF |
688 |
281 |
71% |
29% |
|
|
CONCACAF |
202 |
178 |
53% |
47% |
|
|
CONMEBOL |
62 |
171 |
27% |
73% |
|
|
OFC |
103 |
88 |
54% |
46% |
|
|
UEFA |
333 |
331 |
50% |
50% |
|
|
total matches |
2.239 |
768 |
79% |
25% |
|
|
K=20: friendly matches |
|||||
|
against |
|||||
|
confed |
own confed |
other confed |
own confed |
other confed |
|
|
AFC |
1.323 |
1.399 |
49% |
51% |
|
|
CAF |
1.960 |
907 |
68% |
32% |
|
|
CONCACAF |
1.008 |
1.200 |
46% |
54% |
|
|
CONMEBOL |
357 |
1.273 |
22% |
78% |
|
|
OFC |
92 |
216 |
30% |
70% |
|
|
UEFA |
2.766 |
1.897 |
59% |
41% |
|
|
total matches |
7.506 |
3.346 |
69% |
31% |
|
Observations:
- in general 85% of all matches is intraconfederational;
- CONMEBOL with their 10 member NT's plays the most against teams from other confederations (56%);
- CAF with their 54 member NT's plays the least against teams from other confederations (16%);
- in World Cup matches (60) the interconfederational percentage is logically (because partly forced in the group stage) the highest: 74%;
- continental finals (50) and qualifiers matches (40) are by nature the match types with the lowest percentage interconfederational matches (resp. 12% and 1%);
- the 'friendly' match types (30 and 20) show higher percentages interconfederational matches again with resp. 25% and 31%.
I determined for each year from 1980 until 2022 the compete elo-ranking on January 1st, so position and rating points per team. No longer existing teams were, where applicable, renamed to their current name: West-Germany became Germany, Burma became Myanmar etc. Otherwise no longer existing countries (f.i. East-Germany) and also non-FIFA members are left out of this analysis.
With the dissolution of the Soviet-Union, Czechoslovakia and Yugoslavia a lot of new European countries were created in the beginning of the nineties. I followed the customary line of reasoning in this and considered respectively Russia, Czech Republic and Serbia the rightful successors of these former states.
In order to be able to analyze trends in average elo ratings for the top-x teams per confederation I determined per confederation a ranking of teams based on the average elo ranking position of each team over all 43 year rankings:
|
rank in UEFA |
team |
avg pos |
rank in CAF |
team |
avg pos |
|
|
1 |
Germany |
5,0 |
1 |
Nigeria |
42,1 |
|
|
2 |
Netherlands |
6,4 |
2 |
Egypt |
44,3 |
|
|
3 |
France |
6,5 |
3 |
Cameroon |
46,6 |
|
|
4 |
Spain |
6,7 |
4 |
Ivory Coast |
47,6 |
|
|
5 |
England |
6,9 |
5 |
South Africa |
48,1 |
|
|
6 |
Italy |
7,0 |
6 |
Morocco |
49,4 |
|
|
7 |
Croatia |
12,8 |
7 |
Ghana |
52,8 |
|
|
8 |
Portugal |
14,0 |
8 |
Tunisia |
55,2 |
|
|
9 |
Russia |
16,5 |
9 |
Algeria |
58,5 |
|
|
10 |
Denmark |
16,6 |
10 |
Senegal |
60,2 |
|
|
11 |
Czech Republic |
17,5 |
11 |
Zambia |
69,0 |
|
|
12 |
Sweden |
17,9 |
12 |
Dem. Rep. of Congo |
76,3 |
|
|
13 |
Serbia |
17,9 |
13 |
Mali |
80,5 |
|
|
14 |
Belgium |
21,8 |
14 |
Libya |
80,7 |
|
|
15 |
Romania |
22,6 |
15 |
Guinea |
85,0 |
|
|
16 |
Republic of Ireland |
25,5 |
16 |
Uganda |
88,7 |
|
|
17 |
Poland |
25,9 |
17 |
Zimbabwe |
89,9 |
|
|
18 |
Switzerland |
27,4 |
18 |
Angola |
90,7 |
|
|
19 |
Scotland |
31,9 |
19 |
Gabon |
92,7 |
|
|
20 |
Ukraine |
32,9 |
20 |
Congo |
95,6 |
|
|
21 |
Norway |
36,1 |
21 |
Burkina Faso |
97,4 |
|
|
22 |
Greece |
36,4 |
22 |
Togo |
100,6 |
|
|
23 |
Austria |
37,5 |
23 |
Kenya |
102,1 |
|
|
24 |
Bulgaria |
37,9 |
24 |
Malawi |
106,9 |
|
|
25 |
Turkey |
39,3 |
25 |
Madagascar |
110,1 |
|
|
26 |
Wales |
40,1 |
26 |
Sudan |
110,9 |
|
|
27 |
Slovakia |
41,5 |
27 |
Sierra Leone |
110,9 |
|
|
28 |
Hungary |
42,7 |
28 |
Ethiopia |
115,9 |
|
|
29 |
Israel |
47,3 |
29 |
Liberia |
116,4 |
|
|
30 |
Bosnia and Herzegovina |
51,1 |
30 |
Gambia |
121,1 |
|
|
31 |
Northern Ireland |
54,8 |
31 |
Cape Verde |
121,3 |
|
|
32 |
Slovenia |
55,2 |
32 |
Mozambique |
121,6 |
|
|
33 |
Montenegro |
57,1 |
33 |
Tanzania |
122,2 |
|
|
34 |
Finland |
58,9 |
34 |
Benin |
126,3 |
|
|
35 |
North Macedonia |
63,3 |
35 |
Niger |
128,6 |
|
|
36 |
Georgia |
64,7 |
36 |
Burundi |
129,3 |
|
|
37 |
Iceland |
70,0 |
37 |
Guinea-Bissau |
136,4 |
|
|
38 |
Belarus |
78,5 |
38 |
Central African Republic |
136,5 |
|
|
39 |
Albania |
84,7 |
39 |
Chad |
137,2 |
|
|
40 |
Azerbaijan |
95,6 |
40 |
Namibia |
137,9 |
|
|
41 |
Latvia |
97,6 |
41 |
Rwanda |
145,2 |
|
|
42 |
Kazakhstan |
102,7 |
42 |
Mauritius |
153,0 |
|
|
43 |
Cyprus |
103,8 |
43 |
Botswana |
154,4 |
|
|
44 |
Moldova |
106,3 |
44 |
Lesotho |
154,4 |
|
|
45 |
Kosovo |
107,2 |
45 |
Eswatini |
156,3 |
|
|
46 |
Armenia |
111,0 |
46 |
Equatorial Guinea |
158,0 |
|
|
47 |
Lithuania |
113,6 |
47 |
Mauritania |
158,3 |
|
|
48 |
Estonia |
120,0 |
48 |
Eritrea |
162,8 |
|
|
49 |
Malta |
131,0 |
49 |
Somalia |
174,6 |
|
|
50 |
Faroe Islands |
147,9 |
50 |
São Tomé e Príncipe |
176,5 |
|
|
51 |
Luxembourg |
153,5 |
51 |
South Sudan |
181,2 |
|
|
52 |
Liechtenstein |
165,8 |
52 |
Seychelles |
185,3 |
|
|
53 |
Gibraltar |
178,3 |
53 |
Comoros |
192,8 |
|
|
54 |
Andorra |
183,3 |
54 |
Djibouti |
197,8 |
|
|
55 |
San Marino |
193,9 |
|
rank in AFC |
team |
avg pos |
rank in CONCACAF |
team |
avg pos |
|
|
1 |
Australia |
33,0 |
1 |
Mexico |
17,5 |
|
|
2 |
South Korea |
35,5 |
2 |
United States |
37,6 |
|
|
3 |
Iran |
36,6 |
3 |
Costa Rica |
48,5 |
|
|
4 |
Japan |
47,7 |
4 |
Honduras |
52,5 |
|
|
5 |
Iraq |
54,0 |
5 |
Canada |
60,2 |
|
|
6 |
Saudi Arabia |
60,5 |
6 |
Guatemala |
76,2 |
|
|
7 |
China |
61,0 |
7 |
Trinidad and Tobago |
82,6 |
|
|
8 |
Uzbekistan |
61,0 |
8 |
Jamaica |
82,8 |
|
|
9 |
Kuwait |
74,3 |
9 |
El Salvador |
83,4 |
|
|
10 |
North Korea |
77,1 |
10 |
Cuba |
87,9 |
|
|
11 |
Qatar |
83,0 |
11 |
Haiti |
96,6 |
|
|
12 |
Syria |
90,1 |
12 |
Panama |
99,7 |
|
|
13 |
United Arab Emirates |
91,9 |
13 |
Suriname |
124,0 |
|
|
14 |
Bahrain |
101,0 |
14 |
Saint Vincent and the
Grenadines |
131,0 |
|
|
15 |
Jordan |
105,1 |
15 |
Bermuda |
133,6 |
|
|
16 |
Thailand |
108,4 |
16 |
Grenada |
137,1 |
|
|
17 |
Turkmenistan |
115,5 |
17 |
Barbados |
139,3 |
|
|
18 |
Oman |
119,6 |
18 |
Curaçao |
143,2 |
|
|
19 |
Lebanon |
123,3 |
19 |
Guyana |
151,1 |
|
|
20 |
Tajikistan |
123,8 |
20 |
Saint Kitts and Nevis |
152,0 |
|
|
21 |
Vietnam |
133,8 |
21 |
Saint Lucia |
152,0 |
|
|
22 |
Palestine |
139,8 |
22 |
Antigua and Barbuda |
155,7 |
|
|
23 |
Indonesia |
140,7 |
23 |
Dominica |
165,9 |
|
|
24 |
Malaysia |
141,8 |
24 |
Belize |
169,5 |
|
|
25 |
Hong Kong |
142,9 |
25 |
Dominican Republic |
172,6 |
|
|
26 |
Singapore |
143,0 |
26 |
Aruba |
175,8 |
|
|
27 |
Yemen |
150,4 |
27 |
Nicaragua |
176,7 |
|
|
28 |
Kyrgyzstan |
156,7 |
28 |
Cayman Islands |
181,8 |
|
|
29 |
Myanmar |
159,2 |
29 |
Puerto Rico |
185,1 |
|
|
30 |
India |
160,5 |
30 |
Bahamas |
196,5 |
|
|
31 |
Cambodia |
171,8 |
31 |
British Virgin Islands |
200,0 |
|
|
32 |
Chinese Taipei |
179,8 |
32 |
Turks and Caicos |
209,3 |
|
|
33 |
Pakistan |
185,0 |
33 |
Montserrat |
214,3 |
|
|
34 |
Bangladesh |
185,5 |
34 |
US Virgin Islands |
216,3 |
|
|
35 |
Philippines |
190,8 |
35 |
Anguilla |
222,3 |
|
|
36 |
Maldives |
191,8 |
||||
|
37 |
Afghanistan |
192,9 |
||||
|
38 |
Macau |
194,9 |
||||
|
39 |
Laos |
195,0 |
||||
|
40 |
Nepal |
195,5 |
||||
|
41 |
Sri Lanka |
197,0 |
||||
|
42 |
Mongolia |
200,4 |
||||
|
43 |
Brunei |
205,7 |
||||
|
44 |
Guam |
209,2 |
||||
|
45 |
Bhutan |
218,1 |
||||
|
46 |
Timor-Leste |
224,7 |
|
rank in CONMEBOL |
team |
avg pos |
rank in OFC |
team |
avg pos |
|
|
1 |
Brazil |
2,7 |
1 |
New Zealand |
72,3 |
|
|
2 |
Argentina |
7,1 |
2 |
Tahiti |
110,8 |
|
|
3 |
Uruguay |
17,9 |
3 |
Fiji |
121,3 |
|
|
4 |
Colombia |
24,4 |
4 |
New Caledonia |
134,0 |
|
|
5 |
Chile |
26,3 |
5 |
Solomon Islands |
147,9 |
|
|
6 |
Paraguay |
27,6 |
6 |
Vanuatu |
165,7 |
|
|
7 |
Peru |
41,5 |
7 |
Papua New Guinea |
170,9 |
|
|
8 |
Ecuador |
41,9 |
8 |
Cook Islands |
210,7 |
|
|
9 |
Bolivia |
57,7 |
9 |
Samoa |
211,8 |
|
|
10 |
Venezuela |
77,0 |
10 |
Tonga |
212,1 |
|
|
11 |
American Samoa |
223,8 |
In a graph:
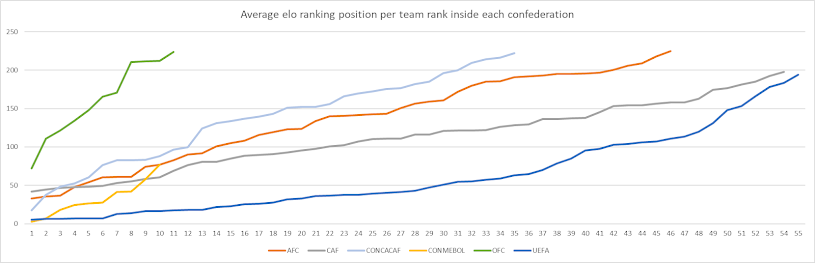
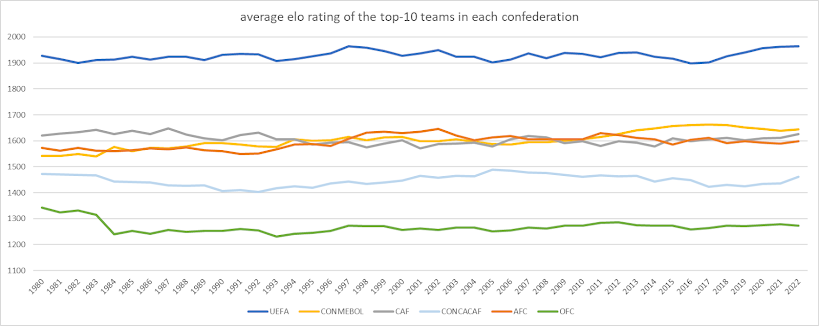
Below are the graphs with the average elo rating over the top-x teams in each confederation.
For the top-10 teams:
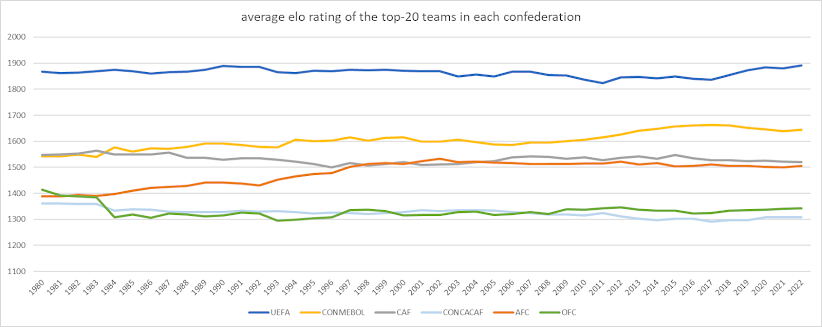
For the top-20 teams:
For the top-30 teams:

Observations:
- UEFA is in all top-x categories the confederation with the highest average rating over all the analyzed years;
- the top-10 teams average rating for AFC, CAF and CONMEBOL lies close together over all the years;
- when we take more teams in consideration CAF and AFC drop a little in average rating (logically) compared to CONMEBOL. You can see that AFC climbs towards the CAF average rating for the top 20 teams during the eighties and nineties;
- for the top-30 teams you can see that CAF has an consistent higher average rating than AFC;
- for the top-10 teams CONCACAF is already lower in average rating than AFC, CAF and CONMEBOL and drops even further away when more than 10 teams are considered.
Another research aspect is the trend over the years in rating difference between for instance UEFA and the other confederations. I've taken UEFA as reference because you can see above that their average rating over the years is nearly constant.
I've put a linear trend line in each graph to easily see if the rating difference is growing of shrinking over the years. For these graphs I consider the average ratings for the top-30 teams so it's only relevant for CAF, AFC and CONCACAF:
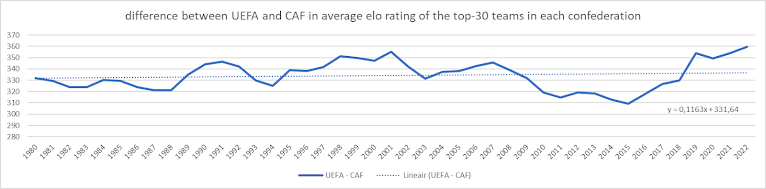
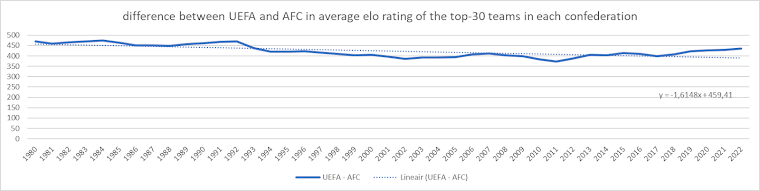

Observations:
- the rating difference for top-30 teams between UEFA and AFC is definitely diminishing over the years;
- for CAF it is slightly growing;
- for CONCACAF it is rapidly growing.
- if a shrinking difference in average rating between two confederations is a sign of underestimation of the strength of the teams in the weaker confederation then not teams from CAF but from AFC are evidently underrated by elo;
- but we also see that for CAF and CONCACAF the average rating difference is growing. Should we then conclude that teams from these confederations are overrated by elo ? No, I think that elo has no regional bias nor is busy adjusting for that regional bias. It is just a sign of confederations becoming stronger of weaker over the years.
- What's in my opinion a strong indicator for the somewhat low elo ratings for CAF's top teams might be the consistently high average rating of the top-30 teams in Africa. The average level of NT's in CAF is stronger than in AFC or in CONCACAF, so points loss by Africa's top teams is simply more likely to occur.
About me:
Software engineer, happily unmarried and non-religious. You won't find me on Twitter or other so called social media. Dutchman, joined the blog in March 2018.
In the last year or so, I've seen 3 potential data points that I find most convincing around Elo having a regionalization problem.
ReplyDelete1- Brazil/Argentina's colossal World Cup winning odds
2- Senegal's relatively low rating despite being African champions
3- Large difference in rating between elo and betting markets on Asian teams (particularly Iran)
When delving into the data though (which you've done a very good job at presenting here) all of these things can be explained through just looking at results.
Brazil and Argentina went undefeated (except to one another) in a very hard CONMEBOL region. Teams in Europe who would be challengers at the WC crown generally did not do that in UEFA.
Senegal has losses and ties to particularly low rated teams (mid-to-high level sides in CAF, but a challenger for the WC should not be dropping points to Guinea, I believe)
And we will certainly see on Iran, et al. I wouldn't be surprised if they challenge in group B, but they are certainly better sides than betting markets have them (dead last in the field).
Thanks as always for your analysis
I'm just now seeing this post, thank you for creating this analysis!
ReplyDeleteI believe the best way to check the conjecture that Elo has a regional bias, is to check if the sum of predicted probabilities in inter-confederation matches is lower/higher than the actual results. That is equivalent to rating change, but has the benefit of being able to calculate the ratios predicted/actual, and the p-value. That's the advantage of using a probabilistic model such as Elo :)
@Ed
If you still have the code for the analysis that would be great if you can generate such data per 4 years time span.
BTW, as Ed showed on a forum, CAF were indeed underrated, at least given the (small) sample in the world cup.
ReplyDeleteWell Amir, there is something to say about the small WC sample that 'shows CAF underestimation'. A lot of their gained FIFA-points this World Cup were gained in matches against B-teams in the third match day of the group stage when the opponents were safely qualified for the knock-out stage: Cameroon - Brazil and Tunisia - France gained Africa nearly 80 points of their overall gain of 127 points in the group stage.
ReplyDeleteAnd Morocco was of course the big contributor, both in the group (in total 58 pts) and in the knock-outs (another 50 pts before bowing out to France and Croatia). But it is the only contributor, the total contributions of the other African teams were minimal: Cameroon 29 pts in the group, Senegal 19 pts in the group, Tunisia 19 pts in the group, Ghana 3 pts in the group.
Okay, it's not as bad with the African participants as previous World Cups, but for now we see only Morocco making a real impact.
Yeah, I agree with most of what you pointed out.
DeleteThe fact that all 5 of them gained point shows me that there it might be the case that they are a bit underrated, and perhaps in a better model, the impact would be bigger.
I think that something like clubelo.com does where it moves extra points for all teams of the relevant associations would have been good here.